National Survey
Survey of 3,960 U.S. Parents of School-Aged Children | January 2026

Share This Page On:
School Choice: From Exception to Expectation
Survey of 3,960 U.S. Parents of School-Aged Children | January 2026
School choice has shifted from a niche exception to a mainstream expectation for American families. In 2025, 75% of U.S. parents—about 46 million nationwide—considered, searched for, or enrolled at least one child in a new or different school, the highest level recorded in five years.
Who is searching for schools, who ultimately chooses new environments for their kids, and why do some parents stop the process before finding somewhere new? Check out these findings, from the National School Choice Awareness Foundation’s January 2026 survey of 3,960 U.S. parents of school-aged children.

For interview opportunities, please contact Lauren Forte at lauren@nscaf.org.
WHO SEARCHED FOR SCHOOLS?
School searchers span the full decision spectrum: 23% of parents (14.5 million) considered new schools, 31% (19.6 million) actively searched but did not enroll, and 21% (13.3 million) enrolled at least one child in a new school. Younger parents, higher-income families, and urban parents were more likely to search, while parents in small towns and rural communities were more likely to follow through with enrollment.

WHY DID PARENTS SEARCH FOR SCHOOLS?
Among parents who enrolled a child in a new school, the most common reason for searching was dissatisfaction with a previous school or a desire for a better fit (32%). Routine transitions were also major drivers of enrollment, including matriculation to a new school level (26%), a child entering school for the first time (20%), and moving or relocation (16%).

WHAT DID PARENTS LOOK FOR IN NEW SCHOOLS?
Parents who enrolled prioritized student well-being above all else, with 61% citing safety, 47% indicating they wanted to find a positive social environment for their children, and 39% identifying educational themes or approaches.

HOW DID PARENTS SEARCH FOR SCHOOLS?
Parents who enrolled were most likely to engage directly with schools. Nearly half visited schools in person (43%), while many used school websites (41%) and general online searches (37%). Conversations also played a major role, including discussions with administrators (36%), family or friends (36%), and other parents (35%), along with open houses or school tours (31%).

WHAT TYPES OF SCHOOLS DO PARENTS ULTIMATELY SELECT?
After enrolling, parents were less likely to choose neighborhood public schools (27%) and more likely to select alternatives such as private religious schools (21%), homeschooling (17%), and full-time online schools (15%). Even so, majorities of parents continue to report having at least one child enrolled in public education.

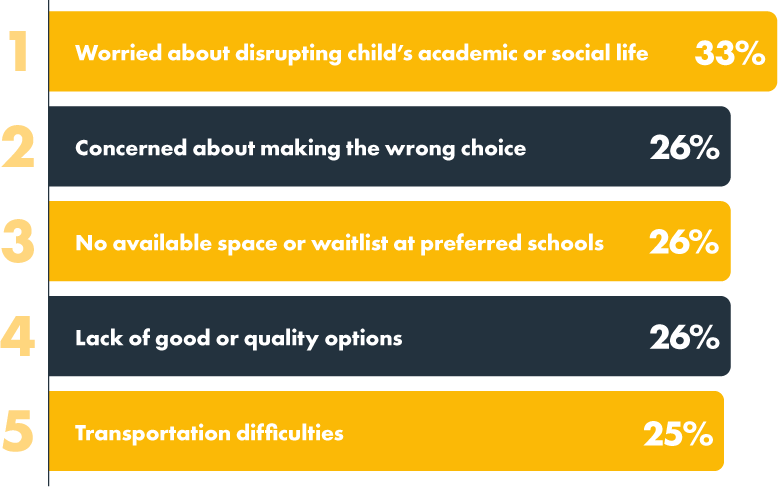
WHEN SEARCHING DOES NOT LEAD TO ENROLLMENT
Despite high demand, 31% of parents—nearly 20 million—searched for a new school but did not enroll a child. The most common barriers were concerns about disruption (33%), uncertainty about making the wrong choice (26%), limited availability or waitlists (26%), and transportation challenges (25%).
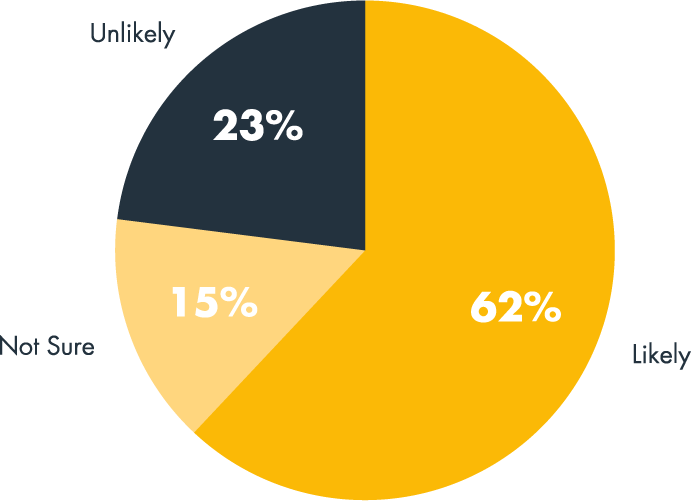
WHO IS LIKELY TO SEARCH FOR A NEW SCHOOL IN 2026?
Looking ahead, 62% of U.S. parents say they are likely to search for a new school in 2026, with the highest levels of planned searching among Black parents, parents living in cities, married parents, higher-income families, Democrats and Republicans alike, and especially military-connected families, 91% of whom say they expect to search.
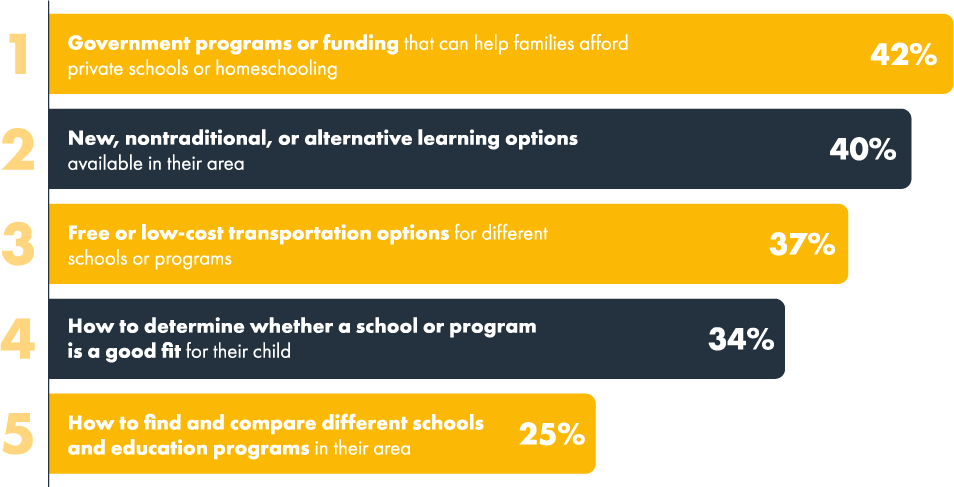
PARENTS WANT MORE INFORMATION
As school choice becomes a mainstream expectation, parents say information—not interest—is the missing link. Forty-two percent want clearer guidance on government programs or funding that can help pay for private school or homeschooling, while 40% want better information about education options in their area.
OUR ROLE
As demand for school choice grows, our role is to help parents turn interest into informed action. Through National School Choice Week, Navigate School Choice, and Conoce tus Opciones Escolares, we provide clear, practical, and trusted information that helps families explore options, compare schools, and navigate enrollment. By improving access to reliable data, tools, and guidance, we aim to reduce uncertainty, lower barriers, and help more parents find schools where their children can thrive.
METHODOLOGY
This report is based on a nationally representative survey of 3,960 U.S. parents of school-aged children ages 4–18, conducted from December 2–10, 2025, using SurveyMonkey’s national audience panel. Results were weighted to reflect the national population of parents by age, race and ethnicity, household income, geographic region, and urbanicity. The margin of error for the full sample is plus or minus 1.6 percentage points at the 95% confidence level. Percentages may not total 100 percent due to rounding or because respondents were permitted to select multiple responses for certain questions.
INDIVIDUAL STATE SURVEYS